Project Background
In the fields of electronic products such as mobile phones, computers, and precision electronic instruments, the electronic components used in them range from electronic tubes to semiconductor separation devices, integrated circuits, and even ultra large scale integrated circuits. The line width of integrated circuits alone has developed from a few micrometers to around 0.1 μ m. So it needs to have a miniaturized, precise, and ultra clean production environment.
Dust is ubiquitous in the production environment, and it can cause significant damage to electronic products such as smartphones and computers. It not only affects the stability of the products, but also shortens their lifespan. Another huge threat to electronic products is static electricity, which adsorbs fine dust, changes the impedance between circuits, and affects the functionality and lifespan of the product.
These issues require a "clean environment" for the production of electronic products such as mobile phones, so the production of mobile phones must be carried out in a clean room (cleanroom) with strict requirements for particles, floating dust, and static electricity.
Present situation:
Disadvantages of existing workshops:
1、 Environmental changes cannot be detected in a timely manner, and personnel cannot be reminded to handle them in a timely manner.
2、 The manual measurement data is inaccurate, and the personnel operation process is the process of dust generation;
3、 Due to the limited amount of data, it is impossible to measure the stability of the environment;
4、 Waste of resources, FFU still operates at full capacity in unmanned areas;
5、 Unable to achieve real-time and accurate positioning of alarm points;
Improve:
Background:
The traditional measurement method, which involves manually measuring and recording data, organizing reports, and implementing improvements by responsible units, is slow in efficiency and has a lag in handling exceptions
Purpose:
Automatic measurement replaces manual measurement, and through real-time monitoring of measurement points, timely alarms are triggered in case of abnormalities. At the same time, the FFU fan is linked to achieve intelligent adjustment
Benefit:
1. Improve work efficiency and reduce labor costs
2. Particle achieves real-time monitoring, automatic abnormal alarm/alert, intelligent wind speed adjustment&energy conservation and emission reduction.
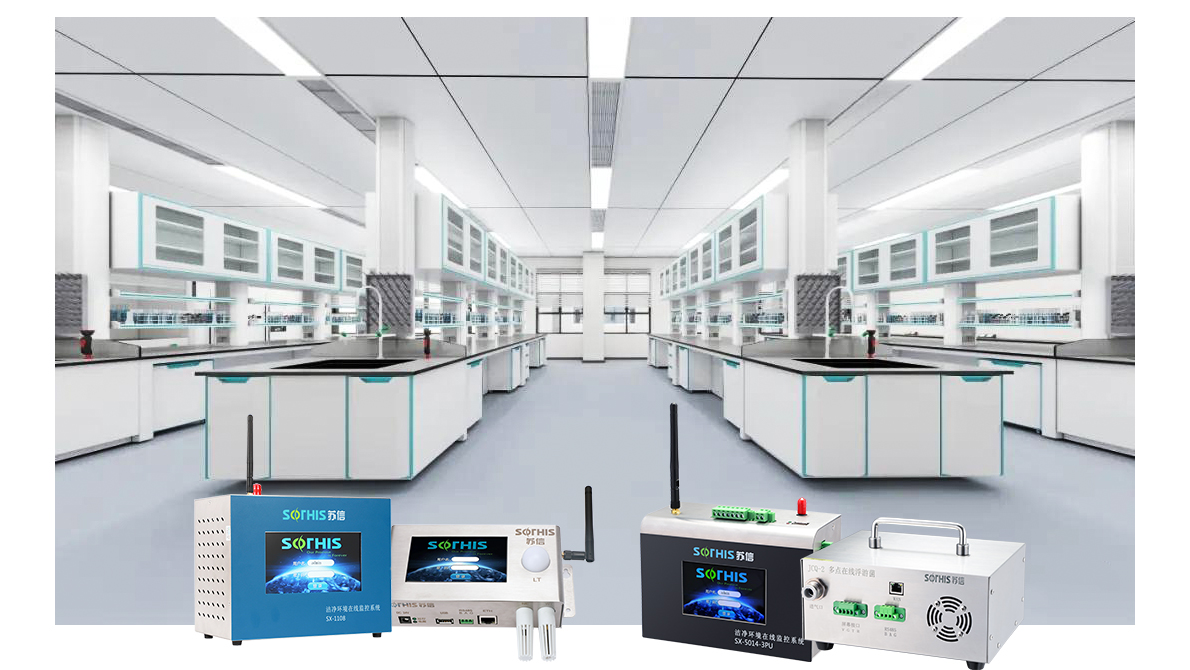
Dust particle linkage FFU architecture
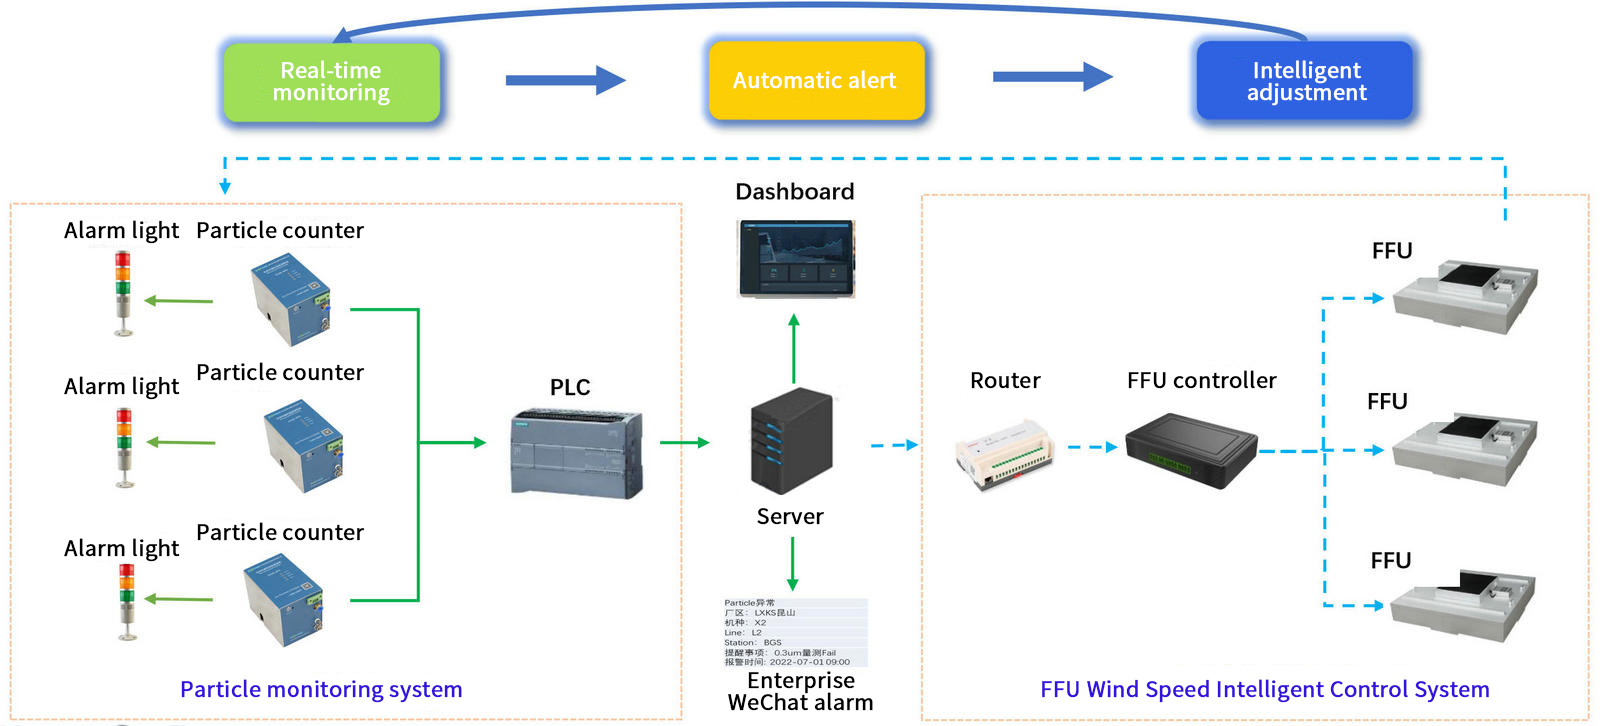
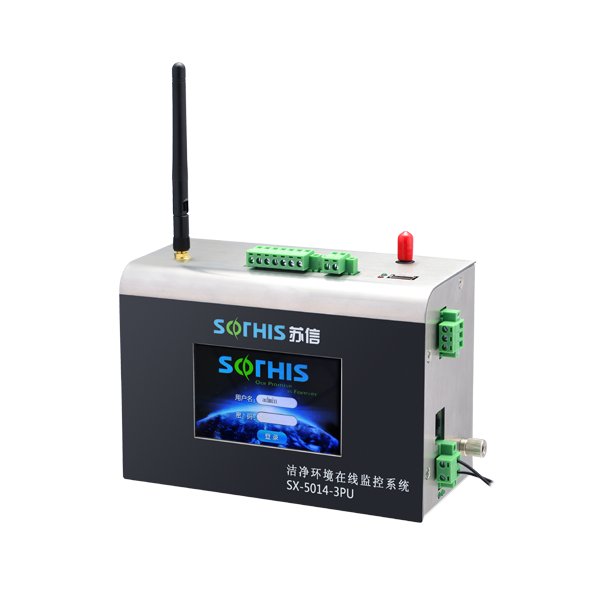
Real time monitoring:
By connecting with the monitoring host, real-time particle detection can be performed, and the data can be displayed centrally or transmitted remotely for continuous monitoring and operationAutomatic alarm:
1.When a measurement point fails, the alarm light will alert through sound, light, or other means
2.When there is an abnormality in the measurement point, the system will automatically provide feedback and remind the enterprise WeChat of the abnormality
Intelligent adjustment:
When a measurement point fails, connect to the server and intelligently adjust the wind speed of the corresponding partition FFU
Main functions
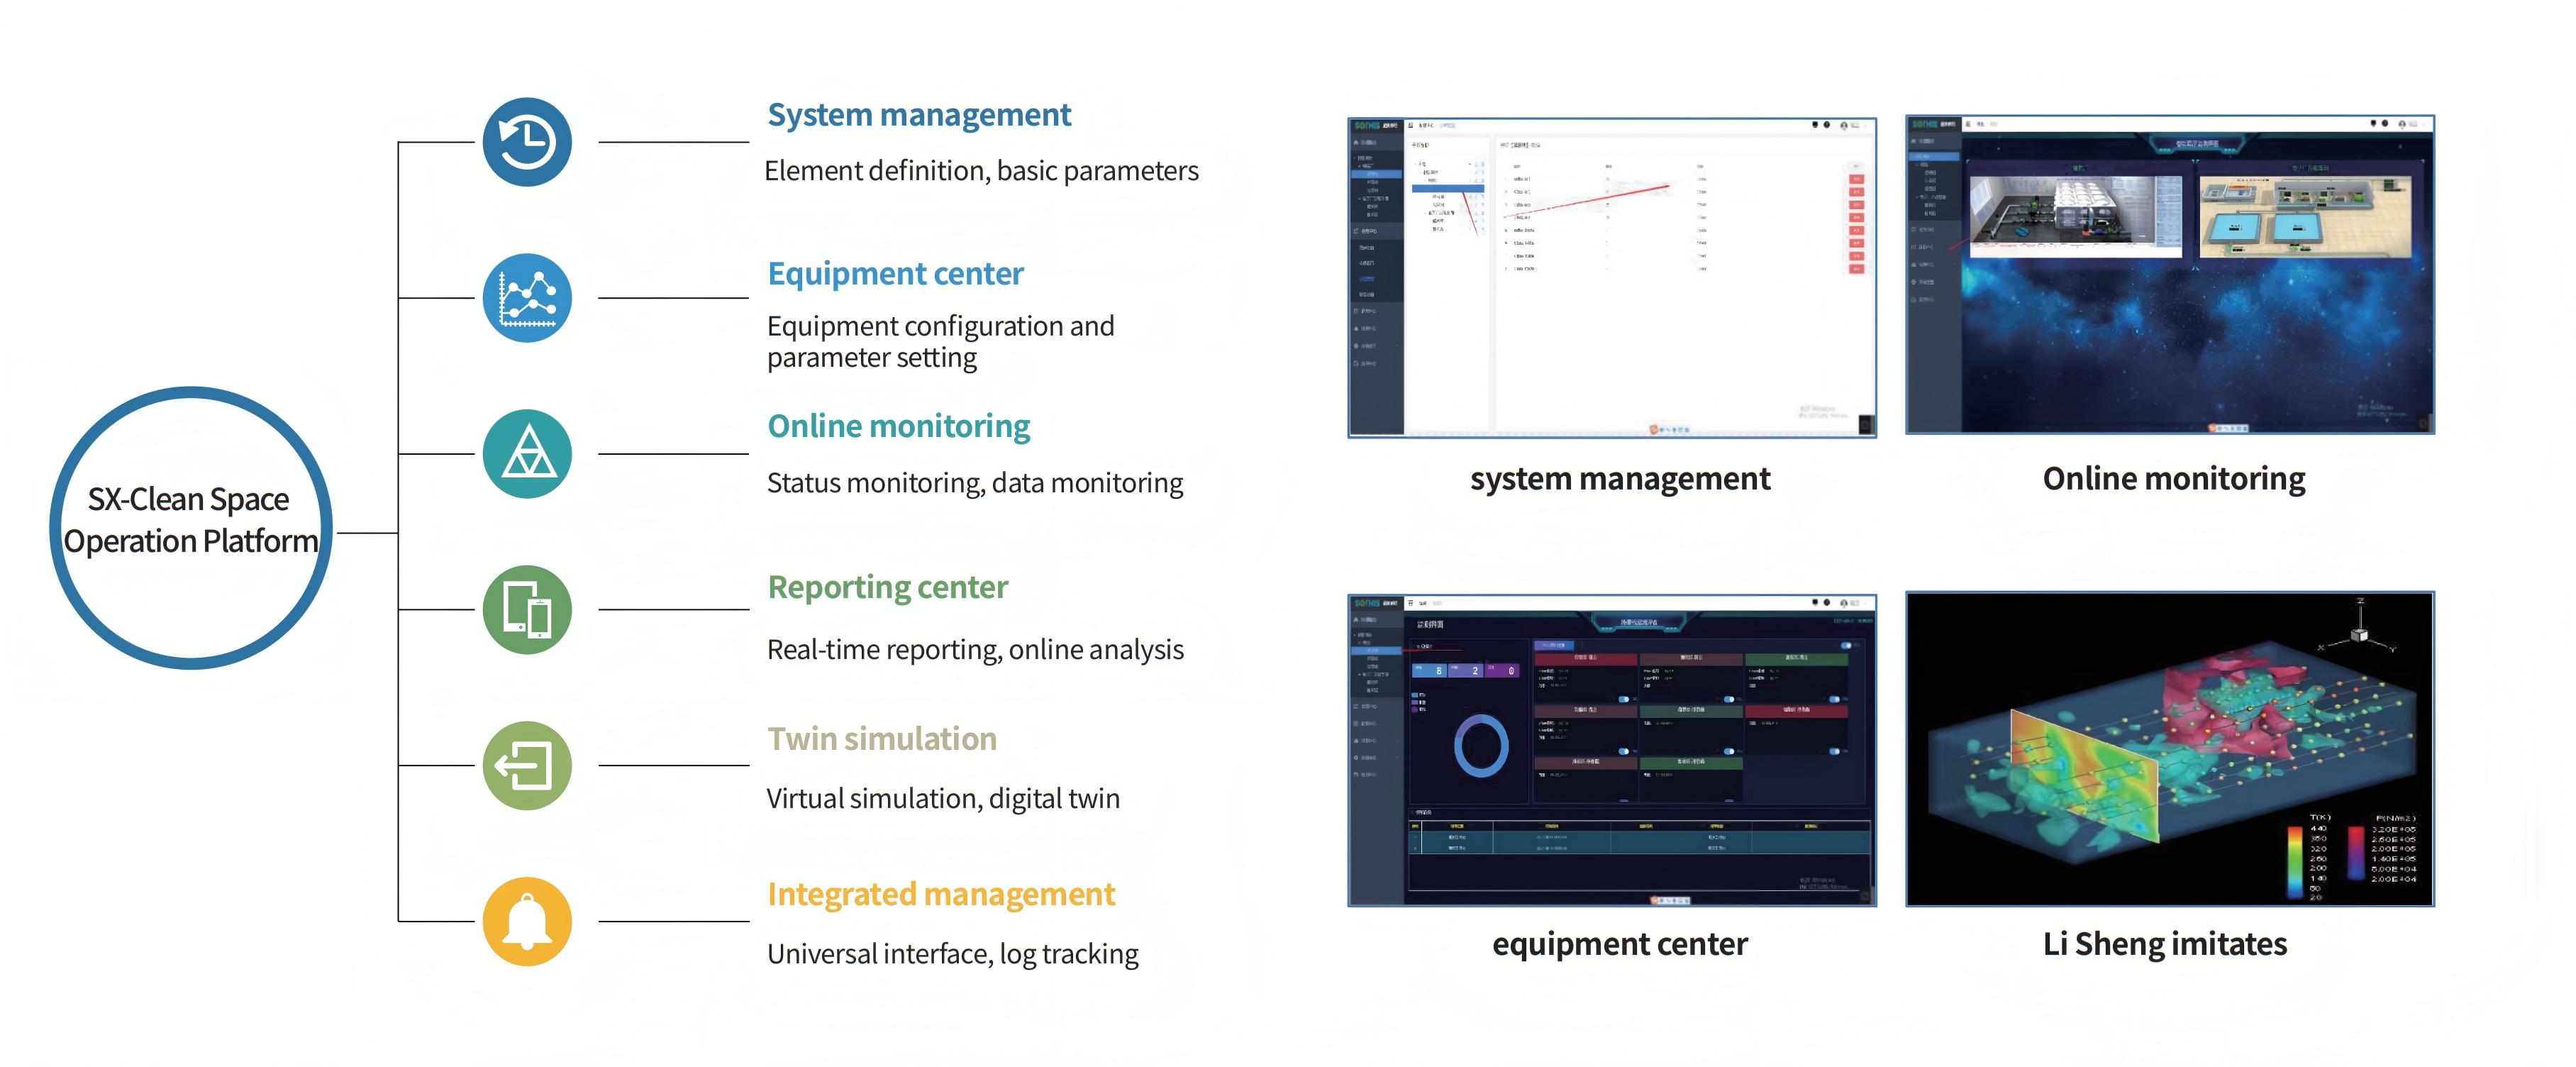
System Features
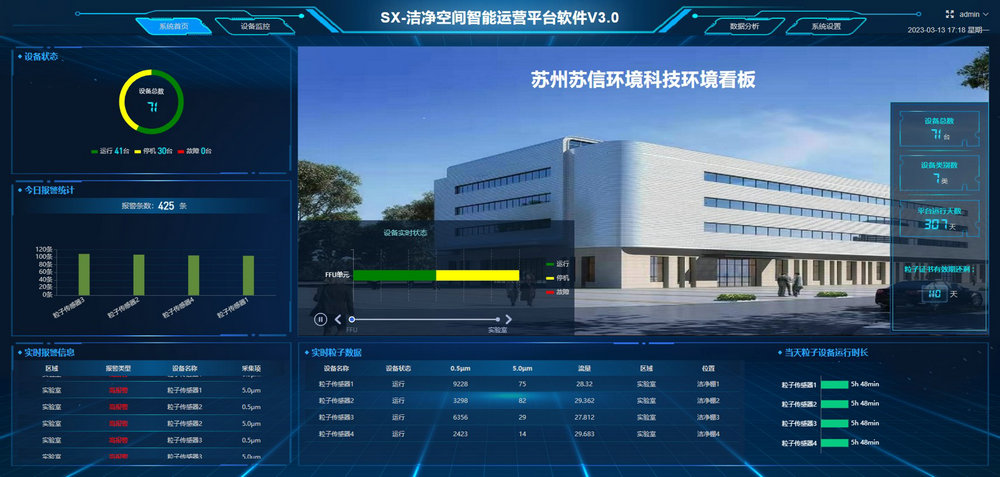
The large screen display is rich in information, and the current device status is displayed through a pie chart. Data statistics include daily alarm ranking, system cumulative operating days, daily device operating hours, real-time alarm information display, dust particle data rolling updates every minute, and verification reminder. The UI design is beautiful and has good human-computer interaction. In addition, the most intuitive UI design is also more beautiful, greatly increasing the user experience.
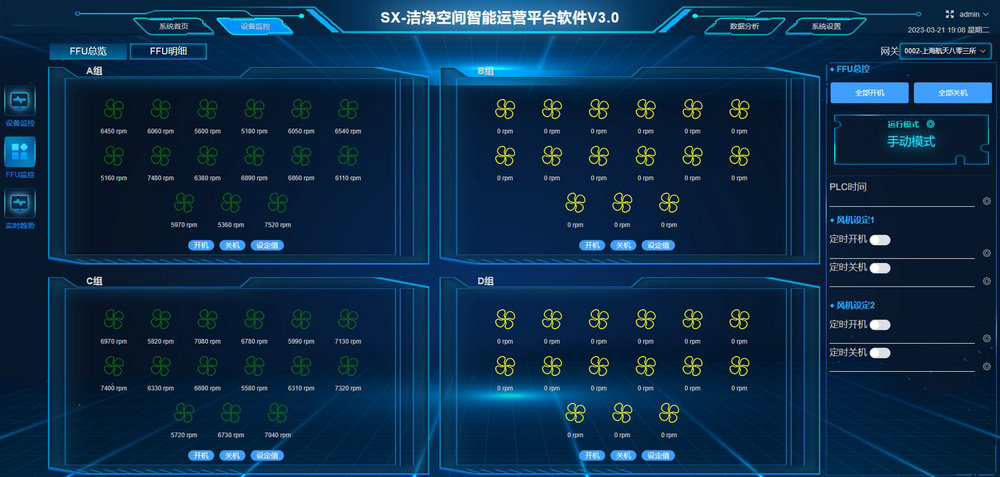
The FFU linkage control interface allows for various personalized settings such as group control, single control, arbitrary control, and timed control of FFUs. In automatic mode, the FFU speed will be adjusted while prioritizing the cleanliness level to achieve energy-saving and emission reduction effects.
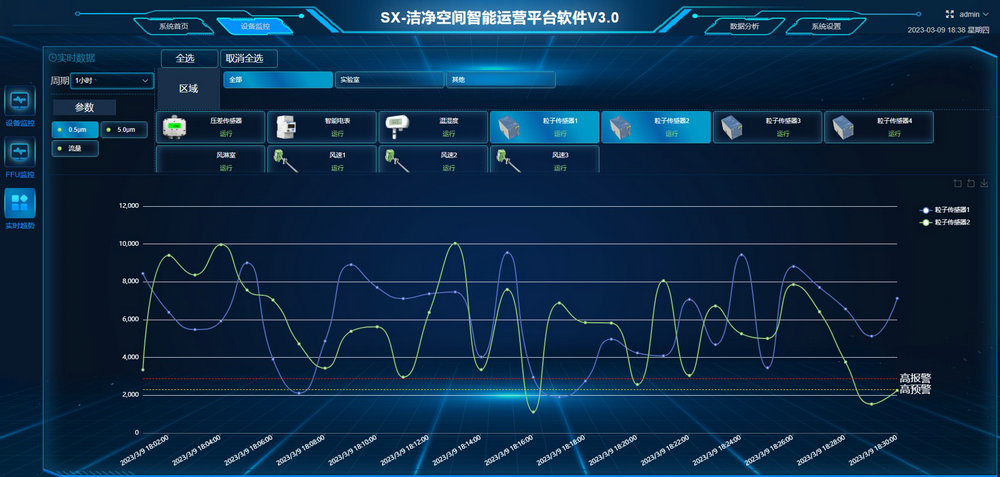
The real-time trend function automatically draws curves and alarm lines. The reference curve will be automatically drawn based on the real-time measured values. Two straight lines will also be used as rulers in the graph, representing the warning line and alarm line respectively, to assist users in intuitively understanding whether the current trend exceeds the relevant standards.
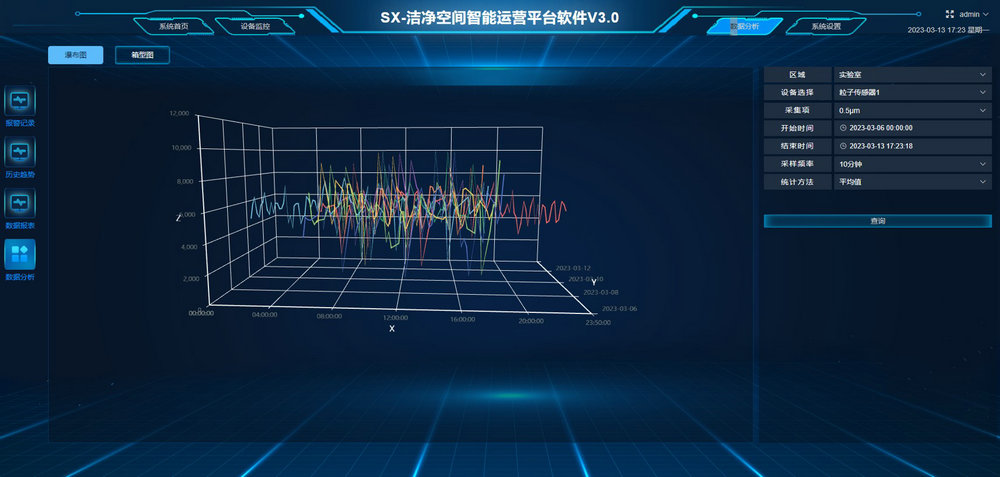
The data analysis and display interface intelligentizes data analysis, optimizes overall parameters through big data algorithms, and graphically displays data statistics (box plots, waterfall plots, etc.) to help customers analyze and trace environmental anomalies and identify problem causes, ultimately improving yield.
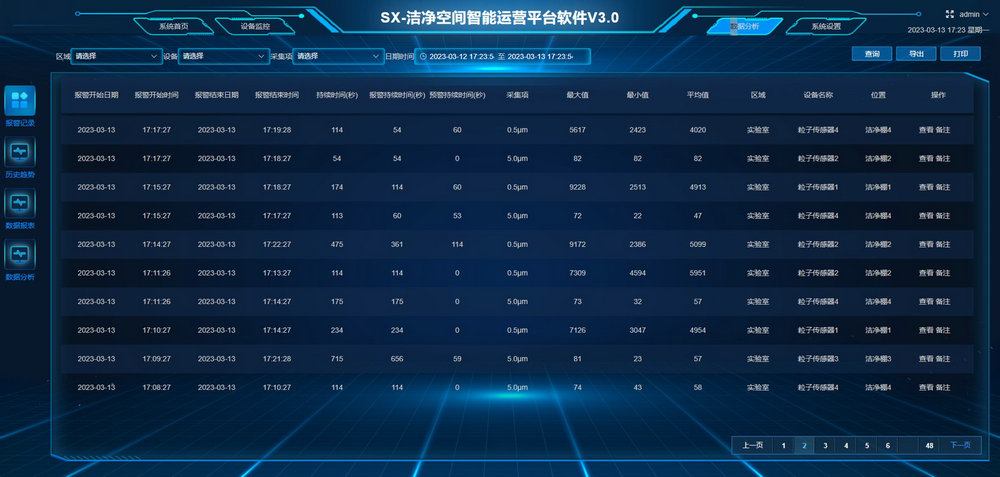
Alarm data, archived and stored for some alarms in the production process, and can be retrieved in the form of reports and bar charts for data analysis